UNITED STATES
SECURITIES AND EXCHANGE COMMISSION
WASHINGTON, D.C. 20549
FORM
CURRENT REPORT
Pursuant to Section 13 or 15(d)
of the Securities Exchange Act of 1934
Date of Report (Date of earliest event reported):
(Exact name of Registrant as Specified in Its Charter)
| (State or Other Jurisdiction of Incorporation) |
(Commission File Number) |
(IRS Employer Identification No.) |
| |
| (Address of Principal Executive Offices, including Zip Code) |
(Registrant’s Telephone Number, Including Area Code)
Not Applicable
(Former Name or Former Address, if Changed Since Last Report)
Check the appropriate box below if the Form 8-K filing is intended to simultaneously satisfy the filing obligation of the registrant under any of the following provisions (see General Instructions A.2. below):
| Written communications pursuant to Rule 425 under the Securities Act (17 CFR 230.425) |
| Soliciting material pursuant to Rule 14a-12 under the Exchange Act (17 CFR 240.14a-12) |
| Pre-commencement communications pursuant to Rule 14d-2(b) under the Exchange Act (17 CFR 240.14d-2(b)) |
| Pre-commencement communications pursuant to Rule 13e-4(c) under the Exchange Act (17 CFR 240.13e-4(c)) |
Securities registered pursuant to Section 12(b) of the Act:
| Title of each class |
Trading Symbol(s) |
Name of each exchange on which registered | ||
Indicate by check mark whether the registrant is an emerging growth company as defined in Rule 405 of the Securities Act of 1933 (§ 230.405 of this chapter) or Rule 12b-2 of the Securities Exchange Act of 1934 (§ 240.12b-2 of this chapter).
Emerging growth company
If an emerging growth company, indicate by check mark if the registrant has elected not to use the extended transition period for complying with any new or revised financial accounting standards provided pursuant to Section 13(a) of the Exchange Act. ☐
Item 7.01. Regulation FD Disclosure.
On March 22, 2022, The RealReal, Inc. (the “Company”) is hosting an Investor Day. The Company issued a press release related to the Investor Day on the same date, a copy of which is furnished as Exhibit 99.1 to this Current Report on Form 8-K and incorporated by reference into this Item 7.01.
As previously announced, a webcast of the Investor Day presentations will be broadcast live over the internet through investorday.therealreal.com, and a replay of the webcast will be available following the event through investor.therealreal.com. In addition, the Company is making publicly available the written presentation materials. These materials are included as Exhibit 99.2 to this Current Report on Form 8-K and are incorporated by reference into this Item 7.01.
The information in this Item 7.01, including Exhibits 99.1 and 99.2, is being furnished and shall not be deemed to be “filed” for purposes of Section 18 of the Securities Exchange Act of 1934, as amended, or otherwise subject to the liabilities of that Section and shall not be deemed incorporated by reference into any registration statement or other document filed pursuant to the Securities Act of 1933, as amended, except as shall be expressly set forth by specific reference in such filing.
Item 9.01. Financial Statements and Exhibits.
(d) Exhibits.
| Exhibit Number | Description | |
| 99.1* | Press Release, dated March 22, 2022 | |
| 99.2* | Investor Day Presentation Materials, dated March 22, 2022 | |
| 104 | Cover Page Interactive Data File (embedded within the inline XBRL document | |
| * | Furnished herewith. |
SIGNATURES
Pursuant to the requirements of the Securities Exchange Act of 1934, the registrant has duly caused this report to be signed on its behalf by the undersigned thereunto duly authorized.
| The RealReal, Inc. | ||||||||
| Date: March 22, 2022 | By: | /s/ Todd Suko |
||||||
| Todd Suko | ||||||||
| Chief Legal Officer and Secretary | ||||||||
Exhibit 99.1
THE REALREAL ANNOUNCES VISION 2025 FINANCIAL TARGETS AT INVESTOR DAY 2022
The Company is Targeting Gross Merchandise Value of $5+ Billion,
Total Revenue of $1.5+ Billion and Positive Adjusted EBITDA of $100+ Million in 2025
SAN FRANCISCO, March 22, 2022 — The RealReal (Nasdaq: REAL)—the world’s largest online marketplace for authenticated, resale luxury goods—today announced its Vision 2025 financial targets and will host its Investor Day later today.
“We are pleased to host our Investor Day at our Phoenix Authentication Center and showcase many of our technology innovations across our operations, including authentication and dynamic pricing. We look forward to discussing in-depth our long-range financial targets, which we are referring to as Vision 2025,” said Julie Wainwright, founder and CEO of The RealReal.
Robert Julian, CFO at The RealReal stated, “As we previously committed, we are targeting positive Adjusted EBITDA for full year 2024, based on strong top-line growth, operational excellence and fixed-cost management. Our Vision 2025 for The RealReal is $5+ billion of Gross Merchandise Value (GMV), $1.5+ billion of Total Revenue and $100+ million of positive Adjusted EBITDA. We look forward to providing more details later today at our Investor Day event.”
The virtual portion of the Investor Day event will feature presentations from The RealReal executive team and a question-and-answer session.
Vision 2025 Long-Range Financial Targets for Full Year 2025
Based on market conditions as of March 22, 2022, we are providing long-term targets for GMV, Total Revenue and Adjusted EBITDA, which is a Non-GAAP financial measure.
| • | GMV of $5.0+ billion |
| • | Total Revenue of $1.5+ billion |
| • | Adjusted EBITDA of $100+ million |
We have not reconciled forward-looking Adjusted EBITDA to net income (loss), the most directly comparable GAAP measure, because we cannot predict with reasonable certainty the ultimate outcome of certain components of such reconciliations, including payroll tax expense on employee stock transactions, that are not within our control, or other components that may arise, without unreasonable effort. For these reasons, we are unable to assess the probable significance of the unavailable information, which could materially impact the amount of future net income (loss).
Live Webcast of Investor Day
Registration for the live webcast of the Investor Day management presentation and question-and-answer session is available at investorday.therealreal.com. The live webcast is scheduled to begin today at 10:00 a.m. Pacific Time (1:00 p.m. Eastern Time) and will run approximately two hours and forty-five minutes. A replay of the webcast, along with the Investor Day management presentation materials, will be available at investor.therealreal.com.
About The RealReal, Inc.
The RealReal is the world’s largest online marketplace for authenticated, resale luxury goods, with more than 25 million members. With a rigorous authentication process overseen by experts, The RealReal provides a safe and reliable platform for consumers to buy and sell their luxury items. We have hundreds of in-house gemologists, horologists and brand authenticators who inspect thousands of items each day. As a sustainable company, we give new life to pieces by thousands of brands across numerous categories—including women’s and men’s fashion, fine jewelry and watches, art and home—in support of the circular economy. We make selling effortless with free virtual appointments, in-home pickup, drop-off and direct shipping. We do all of the work for consignors, including authenticating, using AI and machine learning to determine optimal pricing, photographing and listing their items, as well as handling shipping and customer service. At our 19 retail locations, including our 16 shoppable stores, customers can sell, meet with our experts and receive free valuations.
Investor Relations Contact:
Caitlin Howe
Vice President, Investor Relations
IR@therealreal.com
Press Contact:
Erin Santy
Head of Communications
pr@therealreal.com
Forward Looking Statements
This press release contains forward-looking statements relating to, among other things, the future performance of The RealReal that are based on the company’s current expectations, forecasts and assumptions and involve risks and uncertainties. In some cases, you can identify forward-looking statements by terminology such as “may,” “will,” “should,” “could,” “expect,” “plan,” anticipate,” “believe,” “estimate,” “predict,” “intend,” “potential,” “continue,” “ongoing” or the negative of these terms or other comparable terminology. These statements include, but are not limited to, statements about future operating and financial results, including timeline to profitability, 2025 vision and long-range financial targets. Actual results could differ materially from those predicted or implied and reported results should not be considered as an indication of future performance. Other factors that could cause or contribute to such differences include, but are not limited to, the impact of the COVID-19 pandemic on our operations and our business environment, any failure to generate a supply of consigned goods, pricing pressure on the consignment market resulting from discounting in the market for new goods, failure to efficiently and effectively operate our authentication and fulfillment operations, labor shortages and other reasons.
More information about factors that could affect the company’s operating results is included under the captions “Risk Factors” and “Management’s Discussion and Analysis of Financial Condition and Results of Operations” in the company’s most recent Annual Report on Form 10-K for the year ended December 31, 2021 and subsequent Quarterly Reports on Form 10-Q, copies of which may be obtained by visiting the company’s Investor Relations website at https://investor.therealreal.com or the SEC’s website at www.sec.gov. Undue reliance should not be placed on the forward-looking statements in this press release, which are based on information available to the company on the date hereof. The company assumes no obligation to update such statements.
Non-GAAP Financial Measures
This press release contains Adjusted EBITDA, which is a non-GAAP measure.
We do not, nor do we suggest that investors should, consider non-GAAP financial measures in isolation from, or as a substitute for, financial information prepared in accordance with GAAP. Investors should also note that non-GAAP financial measures we use may not be the same non-GAAP financial measures, and may not be calculated in the same manner, as that of other companies, including other companies in our industry.
Adjusted EBITDA is a key performance measure that our management uses to assess our operating performance. Because Adjusted EBITDA facilitates internal comparisons of our historical operating performance on a more consistent basis, we use this measure as an overall assessment of our performance, to evaluate the effectiveness of our business strategies and for business planning purposes. Adjusted EBITDA may not be comparable to similarly titled metrics of other companies.
We calculate Adjusted EBITDA as net loss before interest income, interest expense, other (income) expense net, provision (benefit) for income taxes, depreciation and amortization, further adjusted to exclude stock-based compensation, employer payroll tax on employee stock transactions, and certain one-time expenses. The employer payroll tax expense related to employee stock transactions are tied to the vesting or exercise of underlying equity awards and the price of our common stock at the time of vesting, which may vary from period to period independent of the operating performance of our business. Adjusted EBITDA has certain limitations as the measure excludes the impact of certain expenses that are included in our statements of operations that are necessary to run our business and should not be considered as an alternative to net loss or any other measure of financial performance calculated and presented in accordance with GAAP.
In particular, the exclusion of certain expenses in calculating Adjusted EBITDA facilitates operating performance comparisons on a period-to-period basis and, in the case of exclusion of the impact of stock-based compensation and the related employer payroll tax on employee stock transactions, excludes an item that we do not consider to be indicative of our core operating performance. Investors should, however, understand that stock-based compensation and the related employer payroll tax will be a significant recurring expense in our business and an important part of the compensation provided to our employees. Accordingly, we believe that Adjusted EBITDA provides useful information to investors and others in understanding and evaluating our operating results in the same manner as our management and board of directors.

Exhibit 99.2 2022 INVESTOR DAY

Welcome and Opening Remarks Caitlin Howe Vice President, Investor Relations 2022 Investor Day 2

Safe Harbor/Disclosure Statement These materials contain forward-looking statements relating to, among other things, the future performance of The RealReal that are based on the company's current expectations, forecasts and assumptions and involve risks and uncertainties. In some cases, you can identify forward-looking statements by terminology such as “may,” “will,” “should,” “could,” “expect,” “plan,” anticipate,” “believe,” “estimate,” “predict,” “intend,” “potential,” “continue,” “ongoing” or the negative of these terms or other comparable terminology. These statements include, but are not limited to, statements about future operating and financial results, including our strategies, plans, commitments, objectives and goals, in particular in the context of the impacts of the COVID-19 pandemic, and our financial guidance, timeline to profitability, 2025 vision and long-range financial projections. Actual results could differ materially from those predicted or implied and reported results should not be considered as an indication of future performance. Other factors that could cause or contribute to such differences include, but are not limited to, the impact of the COVID-19 pandemic on our operations and our business environment, any failure to generate a supply of consigned goods, pricing pressure on the consignment market resulting from discounting in the market for new goods, failure to efficiently and effecti vely operate our merchandising and fulfillment operations, labor shortages and other reasons. More information about factors that could affect The RealReal's operating results is included under the captions “Risk Factors” and “Management's Discussion and Analysis of Financial Condition and Results of Operations” in the company's most recent Annual Report on Form 10-K for the year ended December 31, 2021 and subsequent Quarterly Reports on Form 10-Q, copies of which may be obtained by visiting the company's Investor Relations website at https://investor.therealreal.com or the SEC's website at www.sec.gov. Undue reliance should not be placed on the forward-looking statements in this presentation, which are based on information available to the company on the date hereof. The company assumes no obligation to update such statements . These materials and the accompanying oral presentations also contain statistical data, estimates and forecasts that are based on independent industry publications or other publicly available information, as well as other information based on our internal sources. This information involves many assumptions and limitations, and you are cautioned not to give undue weight to such information. We have not independently verified the accuracy or completeness of the information contained in the industry publications and other publicly available informati on. Accordingly, we make no representations as to the accuracy or completeness of that information nor do we undertake to update such information after the date of this presentation. In addition to financial information presented in accordance with U.S. generally accepted accounting principles (“GAAP”), thi s presentation includes the non-GAAP financial measures of Adjusted EBITDA, Adjusted EBITDA Margin, Total Operating Expense (excluding SBC) and Operating Income/(Loss) (excluding SBC). These non-GAAP measures are presented for supplemental informational purposes only and should not be considered a substitute for financial information presented in accordance with GAAP. These non-GAAP measures have limitations as analytical tools and should not be considered in isolation or as substitutes for analysis of other GAAP financial measures. Reconciliations of these measures to the most directly comparable GAAP measures ar e included at the end of this presentation. We have not reconciled forward-looking Adjusted EBITDA, Adjusted EBITDA Margin, Total Operating Expense (excluding SBC) and Operating Income/(Loss) (excluding SBC) to the most directly comparable GAAP measures of Net Income (Loss), Net Income (Loss) as a percentage of Total Revenue, Total Operating Expense and Operating Income/(Loss) because we cannot predict with reasonable certainty the ultimate outcome of certain components of such reconciliations, including payroll tax expense on employee stock transactions, that are not within our control, or other comp onents that may arise, without unreasonable effort. For these reasons, we are unable to assess the probable significance of the unavailable information, which could materially impact the amount of future Net Income (Loss), Net Income (Loss) as a percentage of Total Revenue, Total Operating Expense and Operating Income/(Loss). 2 20 02 22 2 I In nv ve es sto tor r D Da ay y 3 3

Today’s Agenda Welcome and Opening Remarks 10:00 am 11:20 am 11:20 am Break 10:00 am Caitlin Howe Vice President, Investor Relations Financial Overview Company Overview & Strategy | ESG 11:35 am 10:05 am 11:35 am 10:05 am Robert Julian Julie Wainwright Chief Financial Officer Chief Executive Officer, Founder and Chairperson Sales, Marketing, Operational, 10:35 am Closing Remarks 11:55 am 10:35 am 11:55 am & Commercial Excellence Julie Wainwright Rati Sahi Levesque Chief Executive Officer, Founder and Chairperson President Q&A Session Orr Shakked 12:00 pm Julie Wainwright Chief Marketing Officer Chief Executive Officer, Founder and Chairperson Jessica Fortier Rati Sahi Levesque Senior Vice President, Operations President Rachel Vaisman Robert Julian Vice President, Merchandising Operations Chief Financial Officer Chris Brossman Vice President, Machine Learning and Data Courtney Casabat Senior Director, Merchandise Planning and Pricing

Company Overview, Vision & Strategy Julie Wainwright Chief Executive Officer, Founder and Chairperson 2022 Investor Day 5

1 The RealReal Snapshot (NASDAQ: REAL) June 2011 3,000+ 3.0M 2019 Founded Employees 2021 Orders IPO Date $754M ~$1.5B $467M 2 Market Cap 2021 GMV 2021 Revenue 84% ~$2.5B 2M+ 62 25M+ GMV from Cumulative 3 Customers NPS Score Total Members Repeat Buyers Commission Payouts (1) As of 12/31/21, unless otherwise specified. (2) As of 3/21/22. (3) 2021 Buyer Net Promoter Score compared to NPS score average of 40 for e-commerce industry. #1 Largest Online Marketplace for Authenticated, Resale Luxury Goods 2022 Investor Day 6

Key Messages | Investment Thesis L A R G E T A M L E A D E R I N NA S C E NT D E E P L UX UR Y R E S A L E C O M P E T I T I V E • Nearly $200B worth of luxury M A R K E T M O A T supply in U.S. homes* • World's largest online luxury resale • Proprietary technology and • Total addressable market marketplace with potential for even data (TAM) expected to grow due greater market share to secular tailwinds, including • Breadth of categories sustainability fueling wide • Resale becoming more broadly • Powerful flywheel drives acceptance of resale accepted and embraced by retention and reduces BAC consumers and companies • Full-service for consignors • Expert authentication for buyers • 25M+ members with high engagement (*) Bain & Company Luxury Goods Worldw ide Market Study, 2021, Frost & Sullivan Total Addressable Market assessment for the Luxury Resale Market, and Company estimates. 2022 Investor Day 7

TAM is Large and Propelled by Strong Secular Tailwinds C O V E T E D U N I Q U E O F F E R I N G S A N D S H I F T S I N C O N S U M E R 3 ~$700B A N D S U S T A I N A B I L I T Y D R I V E R E S A L E M I N D S E T A N D B E H A V I O R S 3 World-wide luxury goods available R E S A L E P U R C H A S E S 1 for resale * Top reasons for choosing pre-owned over new-product “What’s clear is that luxury resale is here % respondents naming this a top-two reason to buy pre-owned to stay… these patterns have (new and pre-owned product buyers) ~$196B been accelerated by the pandemic, by US luxury goods available digitization, and by the 36% 1,2 40% for resale 41% so-called ‘generational headwind’: younger buyers (Generation Z and Millennials) are significantly more willing than Generation X and older 5.3 years to purchase pre-owned products.” Average time consumers 1 keep luxury products Sustainability Affordability Access to rare and “While the trade is still largely exclusive products off-line, online platforms are growing very much faster… with a predicted expansion of 20-30% per annum.” ~$37B Annual new supply ACHIM BERG, ET. AL., of luxury goods MCKINSEY & COMPANY, RETAIL PRACTICE 3 for resale * Why do you occasionally buy pre-owned products instead of new products? (1) Frost & Sullivan Total Addressable Market assessment for the Luxury Resale Market, and Company estimates. (3) McKinsey & Company, Retail Practice Report, November 2021, and Company estimates. (2) Bain & Company Luxury Goods Worldw ide Market Study, 2021. 2022 Investor Day 8

O U R M I S S I O N Extend the Life Cycle of Luxury Expertly crafted items are designed to last a lifetime – they can change hands countless times and still retain their beauty and value. We bring expertise and enthusiasm to our mission of extending the life of luxury goods and enable more people to own and appreciate them while giving their original owners the opportunity to maximize the value of their investments. Make Well. Buy Well. Resell. O U R V I S I O N A Real Community Dedicated to a More Sustainable Future TRR is empowering our tens of millions of members to contribute to a more sustainable future and growing a vital community around the circular economy. Luxury is both our platform and our passion. We believe our work has the power to affect wider social change to move us toward a world where all consumption is conscious consumption. The Future of Fashion is Circular 2022 Investor Day 9

ESG is Ingrained in Our Culture and Strategy Environmental Social Governance Pioneering and enabling circular economy, Focusing on diversity and inclusion, employee safety, Ensuring oversight of ESG and ethics and extending the lifecycle of luxury human capital management and data privacy with a diverse, majority female Board products 63% T R R C A R B O N Female Board S U S T A I N A B I L I T Y S A V I N G S C A L C U L A T O R since inception Members 23,603 Closing the Education Gap through Scholarships metric tons W A T E R S A V I N G S since inception 1.1B liters The RealReal Is Carbon Neutral 2022 Investor Day 10

S K I L L S M A T R I X Experienced and Diversified Public Company Executive 38% Board of Directors Strategic Global Business Leader 38% COMMI TTEES COMMI TTEES 25% Technology / Innovation Retail Marketing / Branding 50% Operational Excellence 75% Julie Wainwright James Miller Founder, CEO, Chairperson, CTO, • • Finance / Risk Management 25% The RealReal Wayfair Caretha Coleman Karen Katz Principal, • • • Former CEO, Coleman Consulting B O A R D A T T R I B U T E S Neiman Marcus Group Carol Melton Niki Leondakis Former EVP of Global Public Policy, CEO, • • • • Time Warner Inc. CorePower Yoga ~59 Years 88% Average Age Independent Chip Baird III Rob Krolik Co-Founder, Managing Partner, General Partner, CFO, • • • • GreyLion Capital LP Burst Capital Data above as of 12/31/21. 2022 Investor Day 11 Audit Compensation Corp. Gov D&I Audit Compensation Corp. Gov D&I

Experienced Leadership Team Focused on Execution Rati Sahi Levesque Julie Wainwright Robert Julian CHIEF EXECUTIVE OFFICER, FOUNDER & CHAIRPERSON PRESIDENT CHIEF FINANCIAL OFFICER Orr Shakked Jessica Fortier Michael Sewell CHIEF MARKETING OFFICER SVP, OPERATIONS SVP, ENGINEERING Rachel Vaisman Samantha McCandless Christopher Brossman Courtney Casabat SVP, MERCHANDISING VP, MERCHANDISING OPERATIONS VP, MACHINE LEARNING SR. DIRECTOR, MERCH PLANNING & PRICING 2022 Investor Day 12

We Are the Leader in Our Industry PRIMARY COMPETITION* Brick & Mortar High End Auction Houses Do Nothing/Hold on to Consignment Shops (e.g., Sotheby’s/Christie’s) Luxury Goods CIRCULAR ECONOMY/ High Medium Medium N/A SUSTAINABILITY High High High N/A AOV (Average Order Value) PRODUCT BREADTH High Medium Low N/A High Low Low N/A AUDIENCE ENGAGEMENT TECHNOLOGY-DRIVEN High Low Low N/A High High High N/A SERVICE LEVEL (*) Assigned values denote how w e view our competition 2022 Investor Day 13

Powerful Flywheel: Reduces Buyer Acquisition Costs (BAC) and Drives Retention Among Buyers and Consignors 57% 14% of consignors of buyers are * * are buyers consignors LOWERS ACQUISITION COSTS DRIVES RETENTION Capturing Positive Operating Leverage from Marketing and Repeat Rate (*) In 2021 2022 Investor Day 14

Clear Strategy and Path to Profitability in 2025 Continue to Grow Top-line Target 30%+ per year (over prior year) Drive Operational Excellence and continuous improvement Control Fixed Costs remain relatively flat (~grow with inflation) 2022 Investor Day 15

Key Takeaways | Investment Thesis L A R G E T A M • Nearly $200B worth of luxury supply in U.S. homes* • Total addressable market (TAM) expected to grow due to secular tailwinds, including sustainability fueling wide acceptance of resale L E A D E R I N N A S C E N T L U X U R Y R E S A L E M A R K E T • World’s largest online luxury resale marketplace with potential for even greater market share • Resale is becoming more broadly accepted and embraced D E E P C O M P E T I T I V E M O A T • Proprietary technology and data • Breadth of categories • Powerful flywheel drives retention and reduces BAC • Full-service for consignors • Expert authentication for buyers • 25M+ members with high engagement (*) Bain & Company Luxury Goods Worldw ide Market Study, 2021, Frost & Sullivan Total Addressable Market assessment for the Luxury Resale Market, and Company estimates. 2022 Investor Day 16

Operational & Commercial Excellence Rati Sahi Levesque President

Key Messages | Operational & Commercial Excellence W O R L D - C L A S S P E R F O R M A N C E S A L E S T E A M M A R K E T I N G is the cornerstone of our and high retention rates drive omni-channel strategy down our buyer acquisition cost for generating supply (BAC) C O N T I N U O U S P R O P R I E TA R Y D ATA I M P R O V E M E N T I N A N D T E C H N O L O G Y O P E R AT I O N S to power our competitive leads to variable cost productivity, advantages across the business a key element to attaining profitability 2022 Investor Day 18

2 MAR K E T I N G S AL E S T E AM 1 1 2 How We Generate Consignor Our Omnichannel Approach to Supply Opportunities Generation 4 3 O P E R AT I O NS 4 T E C H NO LOG Y Building Trust and Delivering Excellent How We Stand Out from the Service Efficiently at Scale Competition 3 2022 Investor Day 19

In-Home Sales Team is Our Most Valuable Supply Channel • In-home appointments generate majority of supply F R I C T I O N L E S S • Convenience for consignor: meet them where they are E X P E R I E N C E • Multi-modal optionality reduces friction (virtual, vans) D Y N A M I C • Drives high-value supply C O M M I S S I O N G R I D • Based on product sell-through and micro-trends G R I D O P T I M I Z E S • Drives sales team efficiencies S U P P L Y S A L E S T E A M I S • Consistent annual mid-single digit efficiency gains I N C R E A S I N G • On-track to grow sales team ~20-30% in FY 2022 E F F I C I E N C Y 2022 Investor Day 20

Brick & Mortar Drove 30% of New Consignors* • 19 brick and mortar locations: - 16 shoppable stores 11 neighborhood 5 flagship - 3 luxury consignment offices • Neighborhood stores are highest return on invested capital* in our brick & mortar fleet • Stores provide a halo effect, driving a GMV lift Neighborhood Store of as much as +11%* in geographical area Flagship Store • Customers who shop our stores spend 30%+ more* than the average customer annually, with fewer items returned Luxury Consignment Office (*) In 2021 Stores are a Powerful Supply Generation Tool 2022 Investor Day 21

2 MAR K E T I N G S AL E S T E AM 1 1 2 How We Generate Consignor Our Omnichannel Approach to Supply Opportunities Generation 4 3 O P E R AT I O NS 4 T E C H NO LOG Y Building Trust and Delivering Excellent How We Stand Out from the Service Efficiently at Scale Competition 3 2022 Investor Day 22

Performance Marketing Orr Shakked Chief Marketing Officer
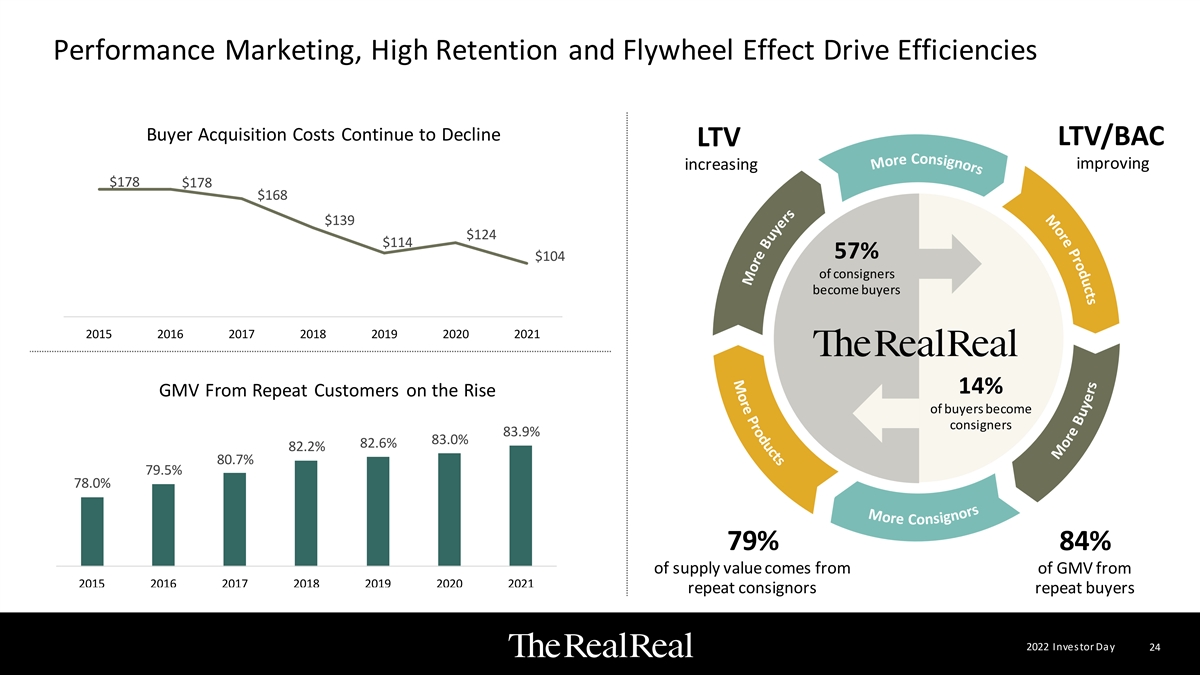
Performance Marketing, High Retention and Flywheel Effect Drive Efficiencies Buyer Acquisition Costs Continue to Decline LTV/BAC LTV Buyer Acquisition Costs Continue to Decline improving increasing $178 $178 $168 $139 $124 $114 57% $104 of consigners become buyers 2015 2016 2017 2018 2019 2020 2021 14% GMV From Repeat Customers on the Rise GMV From Repeat Customers on the Rise of buyers become consigners 83.9% 83.0% 82.6% 82.2% 80.7% 79.5% 78.0% 79% 84% of supply value comes from of GMV from 2015 2016 2017 2018 2019 2020 2021 repeat consignors repeat buyers 2022 Investor Day 24

Active Customers and Consignors Continue to Grow Active Consignors Active Customers Active Consignors by Time Active Customers by Time Between By Tim Si e nSi cen Jo cie nJoin Join and Purchase By Time Since Join 1 2 3 4 5 6 7 8 9 10 1 2 3 4 5 6 7 8 9 10 2012 2013 2014 2015 2016 2017 2018 2019 2020 2021 2012 2013 2014 2015 2016 2017 2018 2019 2020 2021 Same Year 1st_year 2nd_year 3rd_year Same Year 1st_year 2nd_year 3rd_year 4th_year 5th_year 6th_year 7_or_more_years 4th_year 5th_year 6th_year 7_or_more_years REAL’s Marketplace Retains and Grows Customers and Consignors 2022 Investor Day 25

We Attract a Valuable, Younger, and Diverse Audience* Buyers - Age Buyers - Income Buyers - Gender 18-34 < $50k 35-44 F $50 - 100k 45-54 M $100 - 200k 55-64 Over $200k 65+ Consignors - Gender Consignors - Age Consignors - Income 18-34 < $50k 35-44 F $50 - 100k 45-54 M $100 - 200k 55-64 Over $200k 65+ (*) As of Q2 2021 2022 Investor Day 26

Our NPS is Best in Class among Peers % Likelihood to Recommend - NPS Rating (among Ever Used that Brand) • We do all the work for consignors, leading to high satisfaction rates and high repeat business • Our model is the preferred model by both customers and 29 NPS 62 NPS 35 NPS consignors Q12a_1: On a scale from 0 to 10, w here 0 means “not at all likely” and 10 means “extremely likely”, how likely are you to recommend purchasing through each of the follow ing stores to a friend or colleague? Q13b_1: On a scale from 0 to 10, w here 0 means “not at all likely” and 10 means “extremely likely”, how likely are you to recommend selling or consigning through The RealReal to a friend or colleague? Sample Size Aw are of brand: N= 799 The RealReal, N=371 Poshmark, N=199 ThredUp Based on 2021 Aw areness Study fielded by Lisa Miller & Associates – national sample of luxury buyers + TRR shoppers 2022 Investor Day 27

Customers and Consignors are Highly Engaged In 2021… Customers: • Average annual visits per active customer: 127 • Average time per visit: 19 minutes • Percent of customers who “obsess” (or favorite) items: 69% • Average obsesses per customer: 11 Consignors: • Average site visits per active consignor: 214 • Average length per visit: 12 minutes 2022 Investor Day 28
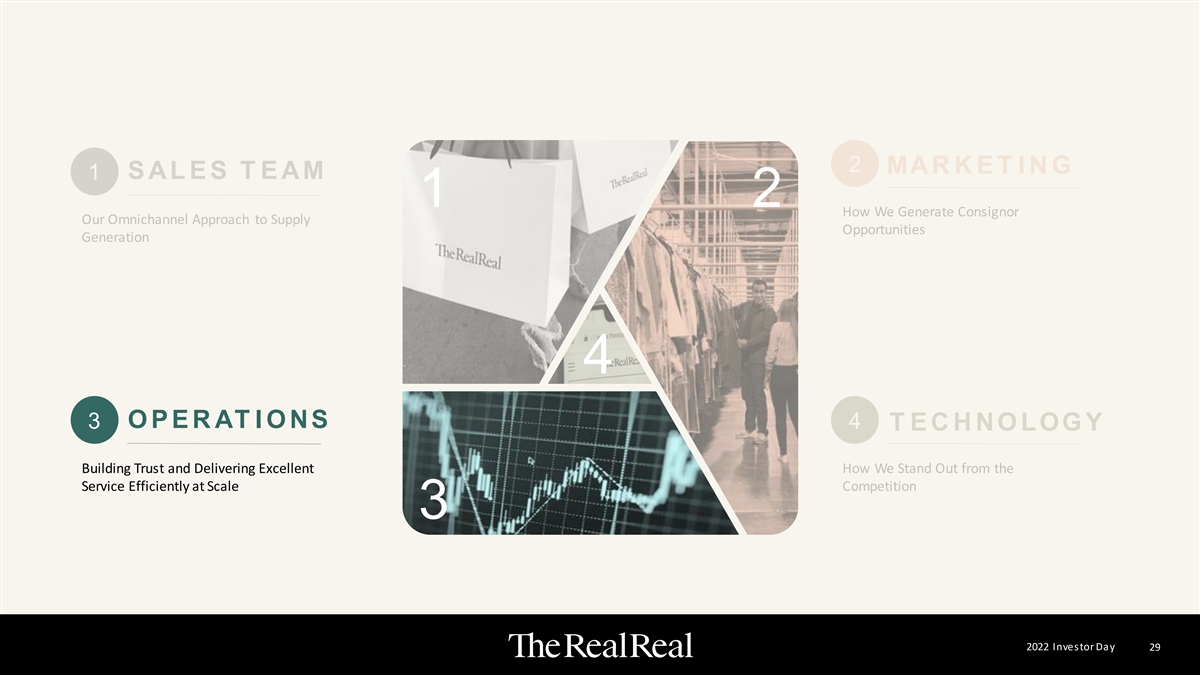
2 MAR K E T I N G S AL E S T E AM 1 1 2 How We Generate Consignor Our Omnichannel Approach to Supply Opportunities Generation 4 3 O P E R AT I O NS 4 T E C H NO LOG Y Building Trust and Delivering Excellent How We Stand Out from the Service Efficiently at Scale Competition 3 2022 Investor Day 29

Operational Excellence & Continuous Improvement Jessica Fortier SVP, Operations

Our Single-SKU Inventory Model is Differentiated and Difficult to Replicate Buyers Become Consignors In-home Pickup SUPPLY SIDE DEMAND SIDE Pick, Pack & Ship Virtual Appointment Online FOUR Purchases AUTHENTICATION Pick, Pack & Ship CENTERS BOPIS In-store Drop Off In-store Purchases Direct Ship Transfer for Final Authentication In-store Drop Off or BUYERS Stores CONSIGNORS Expert Appointment At-home Van Pickup Store Merchandising In-store & Online Order Fulfillment Consignors Become Buyers In 2021, over 25,000 unique items processed per day (>2x 2019 volume) 2022 Investor Day 31 SELF-SERVICE WH I TE G LOVE

Robust Authentication Process is a Key Differentiator Authentication Gemologists Stage 1: Stage 2: Watchmakers Photography & Receiving Quality Quality Photo Editing Control Control Fashion Experts/Authenticators Item Listed for Sale Home & Art Specialists 2022 Investor Day 32

Proprietary Technology Combined with Process Improvements Drive Optimization We Know Authentic Over 100k fakes • Expertise: Large US employer of gemologists, and hundreds of other experts rejected • Accuracy: Proprietary authentication tools and databases of 10M+ items Single SKU Platform at Scale 7% warehouse • Platform: Custom platform built for unique single-SKU luxury environment unit cost savings • Automation: Proprietary technology and data science utilized across item since 2019 acceptance, photography, retouching, listing and pricing Up to 5 days of total We Make it Easy processing time/item • Platform: In-home and self-service powered by sales, retail and van network saved due to copy and • Speed: Item listing automation reducing time to sell and per unit cost retouching automation in 2021 2022 Investor Day 33

What’s Ahead Authentication Leadership at Scale • Employer of choice for experts; experts in training • Predictive risk-management and authentication automation Automation Driving World-Class Service • Specialized support for high-volume consignors • Expand self-service, including AI-powered interactions Cost Optimization Improving Unit Economics • Grow supply with reduced cost per unit • Warehouse densification and automation Unrivaled Luxury Resale Expertise and Scale 2022 Investor Day 34

2 MAR K E T I N G S AL E S T E AM 1 1 2 How We Generate Consignor Our Omnichannel Approach to Supply Opportunities Generation 4 3 O P E R AT I O NS 4 T E C H NO LOG Y Building Trust and Delivering Excellent How We Stand Out from the Service Efficiently at Scale Competition 3 2022 Investor Day 35

Proprietary Technology in Authentication Christopher Rachel Brossman Vaisman VP, Machine Learning VP, Merchandising Operations

New Authentication Technologies Applied to Handbags in 2022 Proprietary Technology Enables Authentication at Scale O P E R AT I ON AL E F F E C T IV E NE S S Route items most likely to be counterfeited to our experienced expert authenticators increasing catch rate C O S T E F F I C I E NCY Unlock authentication at scale using a less specialized workforce G O AL Increase operational efficiency and maintain authentication integrity 2022 Investor Day 37

Intelligent Authentication Routing with Proprietary SHIELD Technology I N I T I A L S T A T E C U R R E N T S T A T E M A C H I N E L E A R N I N G M O D E L : S H I E L D High High P r o p r i e t a r y d a t a f r o m 1 0 + y e a r s o f a u t h e n t i c a t i n g a s w e l l as h i s t o r i c a l p r o d u c t d a t a b a s e s Utilizes historic information of the consignor, product, location data, combined with 360° view of shopping/consigning behavior Low Low DESIGNER/CAT RISK Low High Low High DESIGNER/CAT RISK Attributes employed to predict likelihood of authenticity: Risk screening based on simple heuristics, Intelligent screening on 50+ attributes Previous Method: 2 impacting authenticator scalability drives authentication accuracy at scale New Machine Learning Model: 50+ Item reviewed by Item reviewed by Expert Fake item Authenticator Authenticator 2022 Investor Day 38 CONSIGNOR RISK CONSIGNOR RISK

Authenticate High Value/Risk Items with Proprietary VISION Model Fake V I S I O N – C O N V O L U T I O N A L N E U R A L N E T ### ### ### ### ### ### ### ### ### ### ### ### <<XXX>> <<XX>> Layer 1 Layer 2 Layer 3 Layer 4 Layer 5 Layer 6 and 7 Layer 8 With images of the product, Authentic the VISION Model predicts likelihood inauthenticity 2022 Investor Day 39
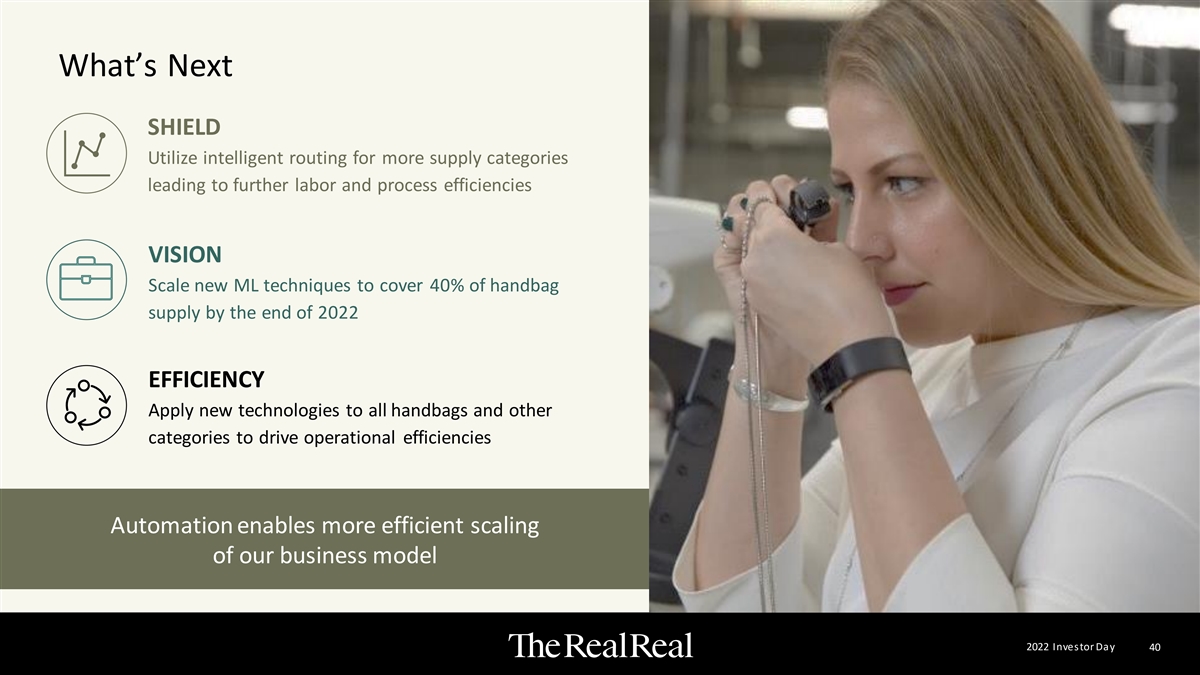
What’s Next SHIELD Utilize intelligent routing for more supply categories leading to further labor and process efficiencies VISION Scale new ML techniques to cover 40% of handbag supply by the end of 2022 EFFICIENCY Apply new technologies to all handbags and other categories to drive operational efficiencies Automation enables more efficient scaling of our business model 2022 Investor Day 40

Dynamic Pricing Courtney Casabat Sr. Director, Merchandise Planning and Pricing

Our Pricing Philosophy Market price for our unique items driven by supply and demand dynamics O U R P R I C I N G I S D Y N A M I C Near real-time data informs pricing W E P U T C O N S I G N O R S F I R S T Selling at optimal price drives repeat consignment * WE C R E A T E S A L E S V E L O C I T Y 60% of all items sell within 30 days 76% of all items sell within 90 days (*) For Full Year 2021 2022 Investor Day 42

Our Iterative Approach to Optimize Prices M O D E L I N C O R P O R A T E S M O R E D A T A P O I N T S M U L T I P L E M A R K E T C O N D I T I O N V A R I A B L E S Sold at $160 K E E P M O D E L F R E S H in 3 days 1 Item Level Attributes Control with market demand * Initial Price and historical selling data $220 U S E E L A S T I C I T Y T E S T S Consignor earned more and 2 paid in similar timeframe to incorporate customer price Item Level Attributes sensitivity Sold at $176 Continuous M O D E L F L E X I B I L I T Y Market Conditions in 10 days Testing 3 Ability to adjust levers based on Initial Price * business needs $220 Pricing Team Input Refreshes constantly (*) Still under development 2022 Investor Day 43

Operational & Commercial Excellence Wrap-Up Rati Levesque President

Key Takeaways | Operational & Commercial Excellence W O R L D - C L A S S S A L E S T E A M is a cornerstone of our omni-channel strategy for generating supply P E R F O R M A N C E M A R K E T I N G and high retention rates drive down our BAC C O N T I N U O U S I M P R O V E M E N T in operations leads to productivity gains and improved unit economics P R O P R I E TA R Y D ATA A N D T E C H N O L O G Y to power our competitive advantages in single-SKU capabilities, authentication, and pricing 2022 Investor Day 45

Our Path to Profitability Robert Julian Chief Financial Officer

Areas of Current and Continued Focus as New CFO Key Observations as New CFO • Differentiated business model with significant competitive advantages: • Full-service • Authentication • Data • Over 25 million members and growing • Powerful flywheel leading to lower BAC • Talented team at all levels of the organization • Business at an inflection point with significant opportunities to leverage fixed cost base and achieve Adj. EBITDA profitability What is Changing? • Focus on different and fewer metrics • More holistic view following flow of the P&L (i.e. more focus on Revenue, Gross Margin, and Operating Expenses as a percent of Revenue) 2 20 02 22 2 I In nv ve es sto tor r D Da ay y 47 47
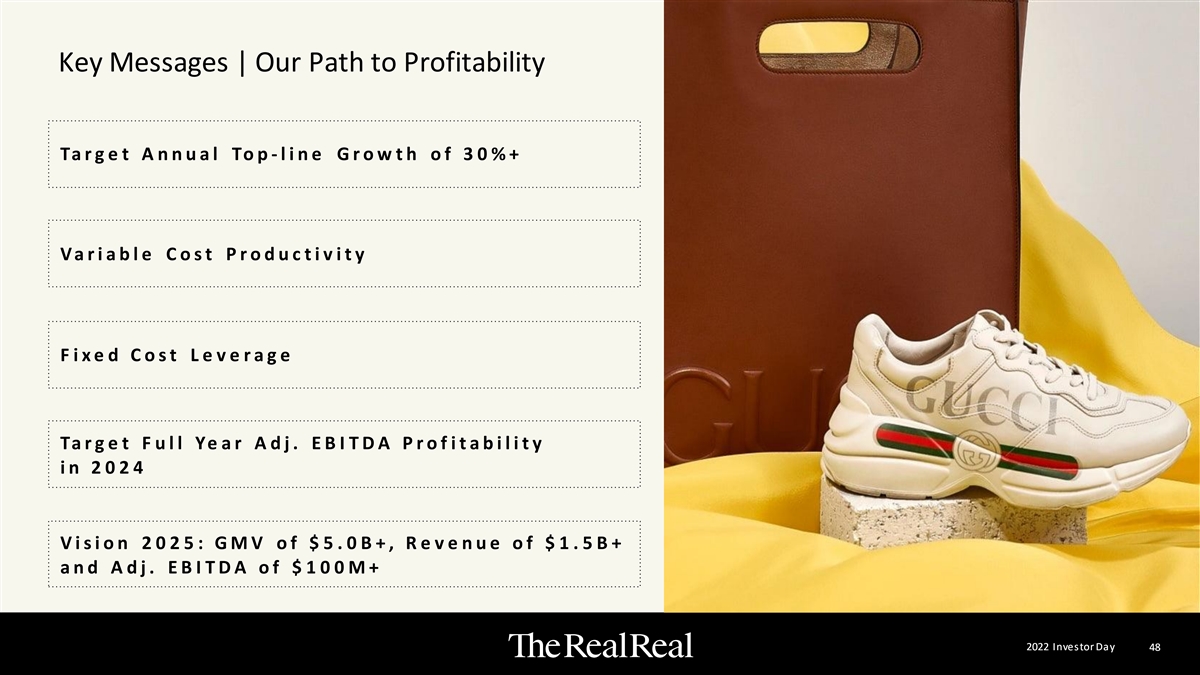
Key Messages | Our Path to Profitability Ta r g e t A n n u a l To p - l i n e G r o w t h o f 3 0 % + V a r i a b l e C o s t P r o d u c t i v i t y F i x e d C o s t L e v e r a g e Ta r g e t F u l l Ye a r A d j . E B I T D A P r o f i t a b i l i t y i n 2 0 2 4 V i s i o n 2 0 2 5 : G M V o f $ 5 . 0 B + , R e v e n u e o f $ 1 . 5 B + a n d A d j . E B I T D A o f $100 M+ 2 20 02 22 2 I In nv ve es sto tor r D Da ay y 48 48

Strong Track Record of Top-Line Growth REVENUE & GMV ($M) G R E A T E R W A L L E T S H A R E Revenue: +37% CAGR from younger generations as a result of our sustainability focus $1,482 GMV: +32% CAGR ~$700B World-wide luxury goods available S T R O N G H I S T O R I C A L 1 for resale $1,008 $987 G R O W T H GMV and Revenue expansion $711 $492 $467 $196B L A R G E T A M $316 US luxury goods available $300 1,2 for resale $214 with historical & future growth $134 opportunity 3 2017 2018 2019 2020 2021 (1) Frost & Sullivan Total Addressable Market assessment for the Luxury Resale Market and Company estimates (2) Bain & Company Luxury Goods Worldwide Market Study, 2021. (3) Denotes initial COVID-19 year 2 20 02 22 2 I In nv ve es sto tor r D Da ay y 49 49

Fixed and Variable Costs Breakdown 2 0 2 1 TO TA L O P E R AT I N G E X P E N S E : $438M Primarily Variable Primarily Fixed & Hybrid • G&A Admin, • Marketing • Sales Occupancy, • Merchandising • Stores / Luxury Consignment Offices Depreciation • Business • Customer Service • Finance Operations • Operations – Inbound, 62% 38% • Human Resources • Product Authentication, and Outbound • Legal • Technology SALES & • Facilities & Loss SUPPORT Prevention OPERATI ONS • Business Strategy & Analytics A R E A S O F F O C U S A R E A S O F F O C U S • Maintaining fixed costs at roughly • Continuous improvement and 2021 level (~grow with inflation) until operational excellence expected to profitability achieved is expected to drive improved unit economics and generate substantial operating variable cost productivity expense leverage • Assuming modest and achievable • Leverage prior investments improvement over time 2 20 02 22 2 I In nv ve es sto tor r D Da ay y 50 50
Leveraging Prior Investments Enhancements to Infrastructure/Fixed Costs: • Accelerated authentication center move from CA to AZ • Accelerated neighborhood store strategy to drive supply acquisition • Grew technology/development budget to cement and enhance data/technology advantage • Scaled support functions, including finance, HR, legal, transportation/logistics Optimizing Fixed Cost Base and Scaling for Growth 2 20 02 22 2 I In nv ve es sto tor r D Da ay y 51 51

Path to Vision 2025 FY 2022E FY 2021 FY 2025E Mid-point of Actual Vision Guidance (in millions, except percentages) Gross Merchandise Value $1,482 $2,050 $5,000+ Total Revenue $468 $650 $1,500+ Gross Profit $273 $390 $950 as % of Revenue 58.4% 60.0% 63.3% Total Operating Expense - excl. SBC $439 $505 $880 as % of Revenue 93.9% 77.7% 58.7% Operating Income/(Loss) - excl. SBC $(166) $(115) $70 as % of Revenue (35.5)% (17.7)% 4.7% Adj. EBITDA $(127) $(90) $100+ as % of Revenue (27.1)% (13.8)% 6.7% Vision 2025: $5.0B+ of GMV, $1.5B+ of Revenue, and $100M+ of Adj. EBITDA 2 20 02 22 2 I In nv ve es sto tor r D Da ay y 52 52

Target Adj. EBITDA Margin Bridge ~425 - 450 bps Gross Margin Expansion: Direct ~6.5 - 7.0% Revenue to decrease as a percent of ~(150) - (200) bps Total Revenue over time ~1450 - 1500 bps Fixed Cost Leverage: Control fixed 0% costs through leveraging prior investments and thoughtfully managing fixed cost growth Variable Cost Productivity: Utilization ~325 - 350 bps of technology, automation and AI to improve unit economics ~(13.5) - (14.0)% Projecting Significant Adj. EBITDA Margin Expansion by 2025 2 20 02 22 2 I In nv ve es sto tor r D Da ay y 53 53

Strategic Capital Deployment Focused on Growth R E I N V E S T F O R G R O W T H R E A C H S T R O N G P R O F I TA B I L I T Y F I N A N C I A L • Prioritize growth given F O U N DAT I O N significant near- and mid- term opportunities • Targeting positive Adj. EBITDA in 2024 • $418M in Cash and • Modest incremental Cash Equivalents* investment in technology • Significant Cash on hand and automation to drive • Targeting Operating operational efficiencies Cash Flow positive in • Positive Operating Cash 2025 Flow targeted for 2025 • Modest incremental investment in sales force to • Convertible notes generate supply mature in 2025 and 2028 • Strategically assess opportunities for brick-and- mortar store expansion (*) As of 12/31/21 54 2 20 02 22 2 IIn nv ve est sto or r D Da ay y 54 54 ANIK Virtual Investor Day |

Key Takeaways | Our Path to Profitability V i s i o n 2 0 2 5 A d j . E B I T D A G M V : $ 5 . 0 B + F i x e d C o s t T a r g e t A n n u a l V a r i a b l e C o s t P r o f i t a b i l i t y in R e v . : $ 1 . 5 B + L e v e r a g e P r o d u c t i v i t y T o p - l i n e G r o w t h 2024 A d j . E B I T D A : $ 1 0 0 M + o f 3 0 % + 2 20 02 22 2 I In nv ve es sto tor r D Da ay y 55 55

Q&A 2 20 02 22 2 I In nv ve es sto tor r D Da ay y 56 56

Appendix 2 20 02 22 2 I In nv ve es sto tor r D Da ay y 57 57

Non-GAAP to GAAP Reconciliation Tables 2022 Investor Day 58