The RealReal Announces Third Quarter 2019 Results
Q3 Total Revenue Increased 55% Year over Year to $80.5 million
Q3 Gross Merchandise Value Increased 48% Year over Year to $252.8 million
SAN FRANCISCO, Nov. 04, 2019 -- The RealReal (Nasdaq: REAL)--the world’s largest online marketplace for authenticated, consigned luxury goods--today reported financial results for its third quarter ended Sept. 30, 2019.
Third Quarter Financial Highlights
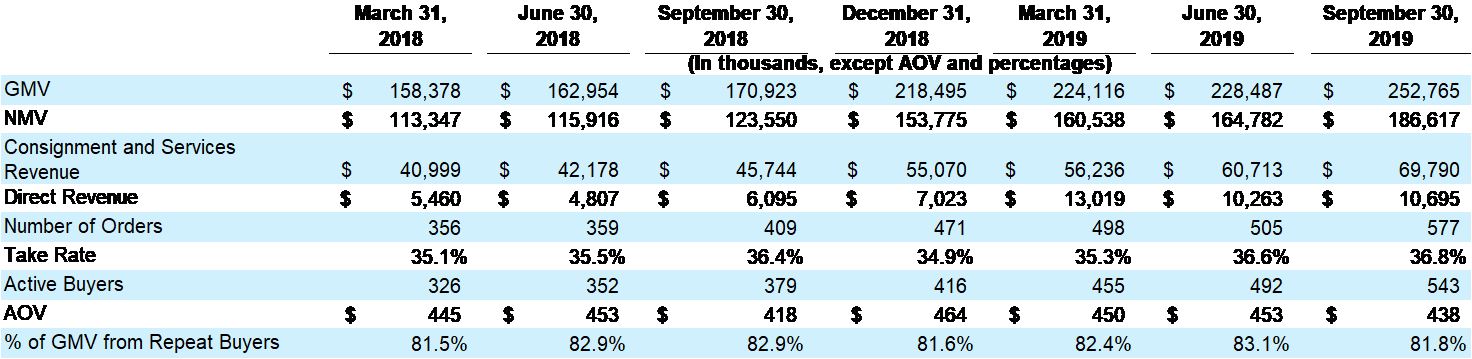
- Gross Merchandise Volume (GMV) increased $81.8 million to $252.8 million, up 48% year over year.
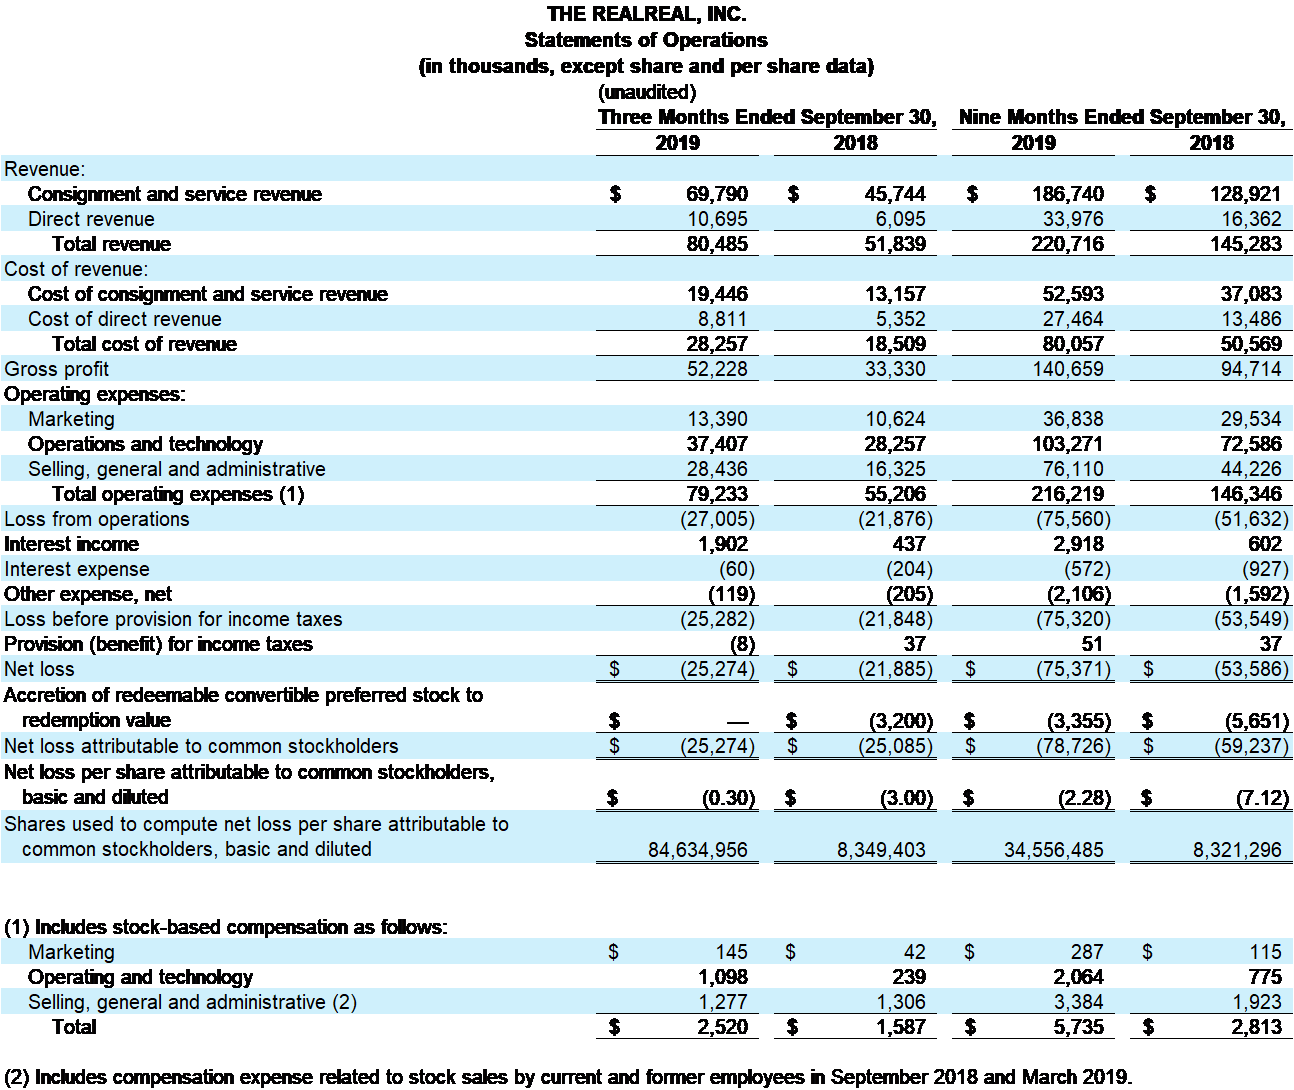
- Total Revenue increased $28.7 million to $80.5 million, up 55% year over year.
- Consignment and Service Revenue increased $24.0 million to $69.8 million, up 53% year over year.
- Direct Revenue increased $4.6 million to $10.7 million, up 75% year over year.
- Gross Profit increased $18.9 million to $52.2 million, up 57% year over year.
- Adjusted EBITDA was $(20.9) million or (26.0%) of total revenue.
- GAAP basic and diluted net loss per share was ($0.30).
- Non-GAAP diluted net loss per share was ($0.27).
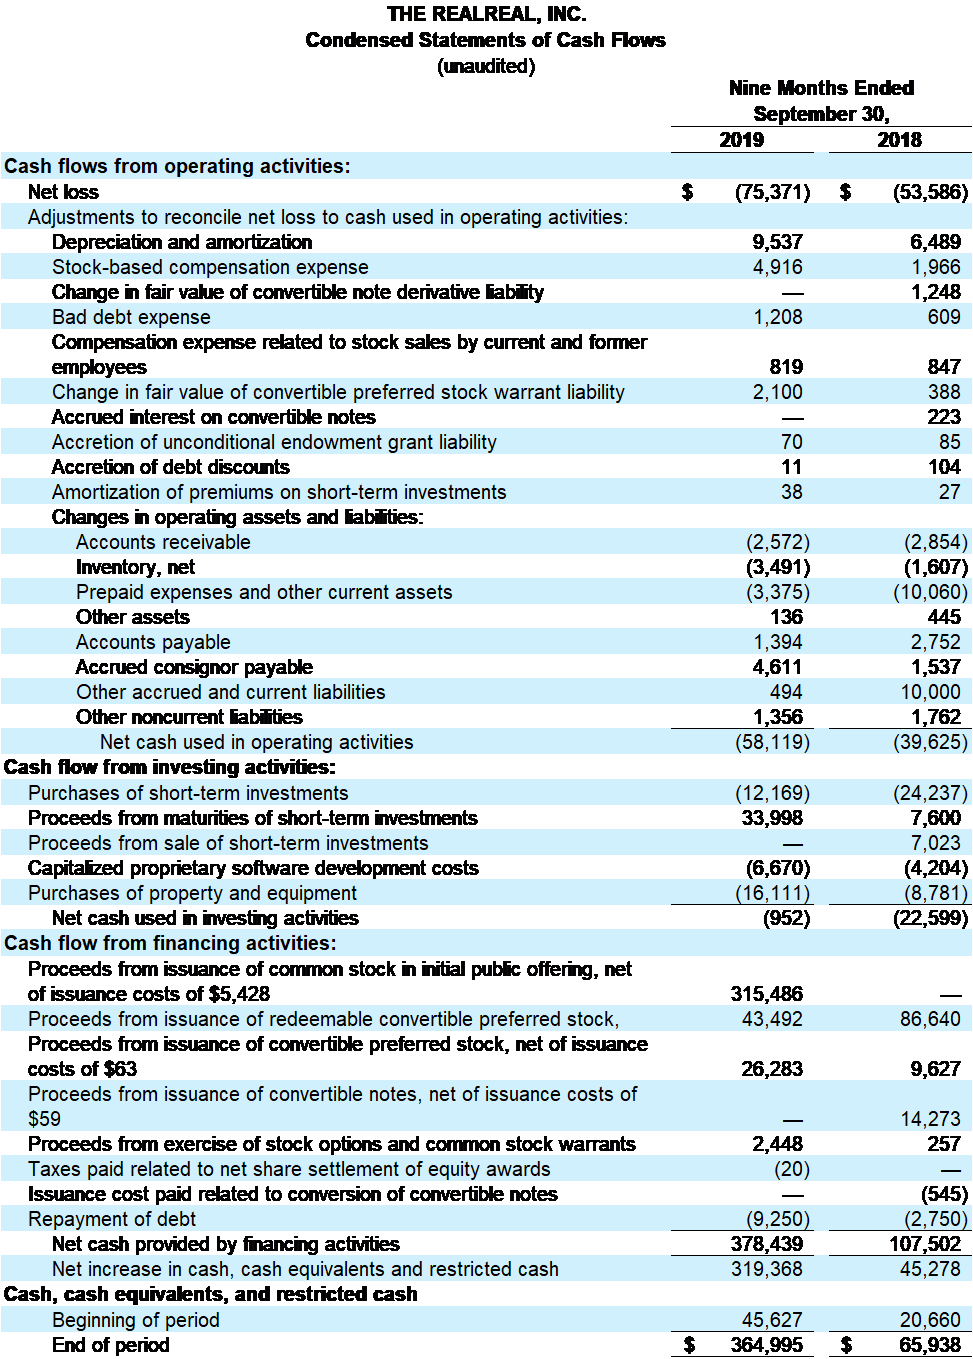
- Free cash flow was ($20.8) million.
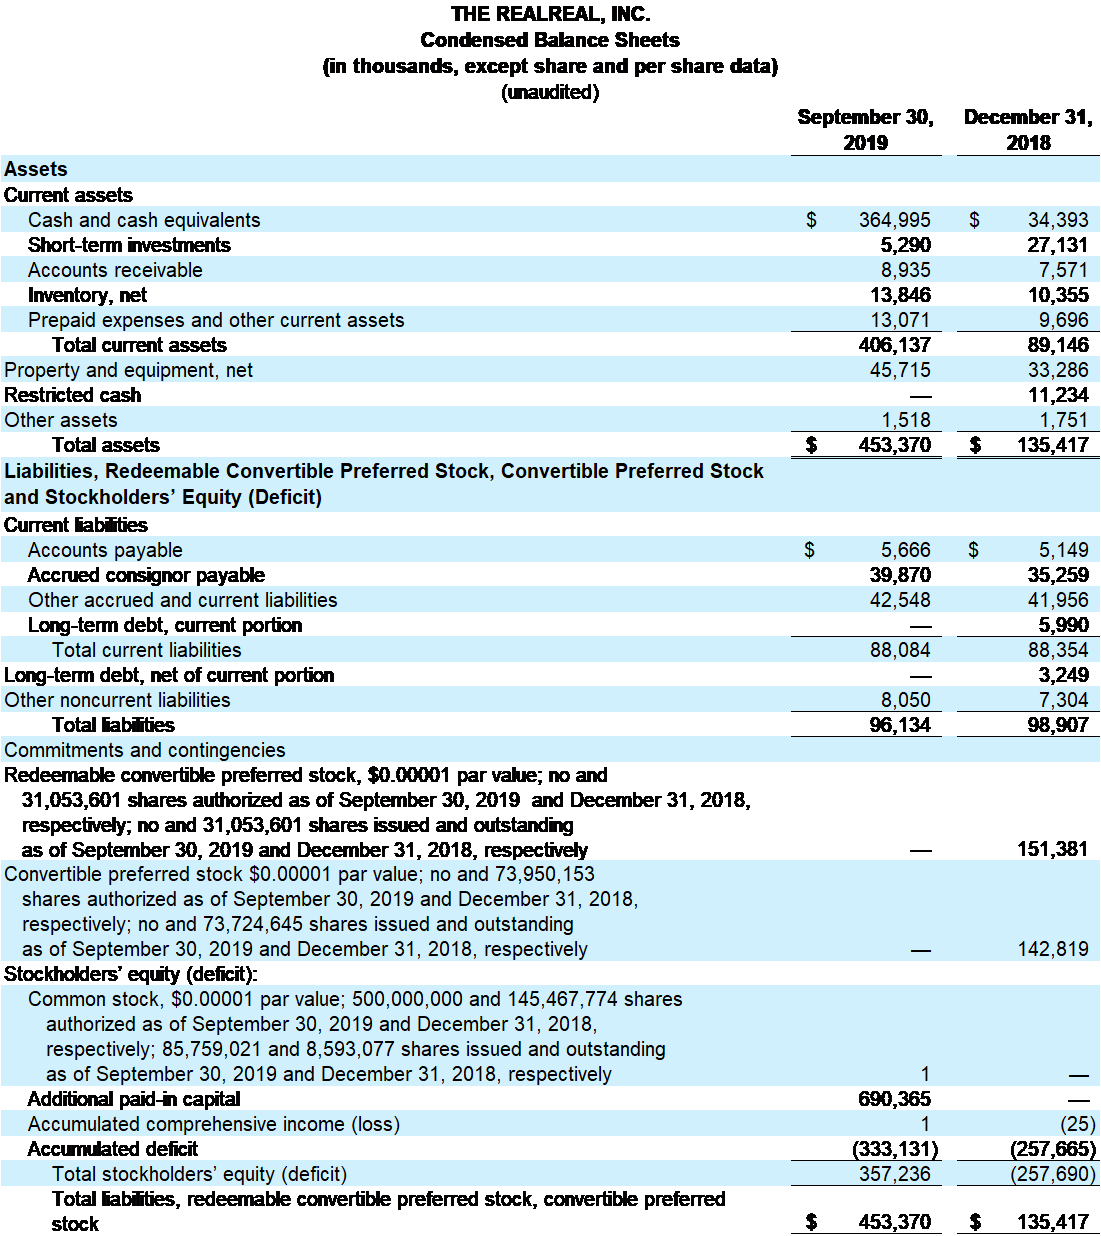
- At the end of the third quarter, cash, cash equivalents and short-term investments totaled $370.3 million.
“Q3 was a very strong quarter and speaks to the health and vibrancy of our marketplace. GMV and revenue growth accelerated, and we saw increased leverage in marketing as well as operations and technology,” said Julie Wainwright, CEO and founder. “We are proud of the accelerating growth and operating leverage we demonstrated during the quarter, which we believe speaks to several unique aspects of our model including high buyer repeat rates and our flywheel where buyers become consignors and consignors become buyers.”
Other Third Quarter Highlights
- Trailing 12 months active buyers reached 542,987, up 43% year over year.
- Orders reached 577,421, up 41% year over year.
- Average Order Value was $438 compared to $418 in the third quarter of 2018.
- Take Rate increased 40bps year over year to 36.8%.
- GMV from repeat buyers was 81.8% compared to 82.9% in the third quarter of 2018.
4Q and 2019 Financial Outlook
Based on information available as of Nov. 4, 2019, we are providing the following financial guidance for the fourth quarter as well as updated guidance for the full year 2019.
| (in Millions) | |||||||||||||
| Fourth Quarter 2019 | Full Year 2019 | ||||||||||||
| Low | High | Low | High | ||||||||||
| Expected GMV Range | $292 | $300 | $997 | $1,005 | |||||||||
| Implied Y/Y Growth | 34% | 37% | 40% | 41% | |||||||||
| Expected EBITDA % of Revenue Range | (15%) | (14%) | (24%) | (23%) | |||||||||
Webcast and Conference Call
The RealReal will host a conference call and webcast to discuss its third quarter 2019 financial results today at 2 p.m. (PDT). Investors and participants can access the call by dialing (866) 996-5385 in the U.S. and (270) 215-9574 internationally. The passcode for the conference line is 8141249. The call will also be available via live webcast at investor.therealreal.com along with supporting slides. An archive of the webcast conference call will be available shortly after the call ends. The archived webcast will be available at investor.therealreal.com.
About The RealReal, Inc.
The RealReal is the world’s largest online marketplace for authenticated, consigned luxury goods. With an expert behind every item, we provide a safe and reliable platform for consumers to buy and sell their luxury items. We have 100+ in-house gemologists, horologists and brand authenticators who inspect thousands of items available online each day. As a sustainable company, we give new life to pieces by brands from Gucci to Cartier, and hundreds more, supporting the circular economy. We make consigning effortless with free in-home pickup, drop-off service and direct shipping for both individual consignors and estates. At our stores in Los Angeles as well as SoHo and the Upper East Side NYC, customers can shop and consign and meet with our experts to learn more about luxury authenticity and sustainability. At our nine Luxury Consignment Offices, three of which are located in our retail stores, our expert staff provides free valuations for high-value pieces.
Investor Relations Contact:
Paul Bieber
Head of Investor Relations
paul.bieber@therealreal.com
Press Contact:
Erin Santy
Head of Communications
pr@therealreal.com
Forward Looking Statements
This press release contains forward-looking statements within the meaning of federal and state securities laws, including statements about future operating results, our ability to drive revenue growth and our ability to drive operating leverage. Forward-looking statements are based on current expectations of future events. We cannot guarantee that any forward-looking statement will be accurate, although we believe that we have been reasonable in our expectations and assumptions. Investors should realize that if underlying assumptions prove inaccurate or that known or unknown risks or uncertainties materialize, actual results could vary materially from our expectations and projections. Investors are therefore cautioned not to place undue reliance on any forward-looking statements. These forward-looking statements speak only as of the date of this press release and, except as required by applicable law, we undertake no obligation to publicly update or revise any forward-looking statements contained herein, whether as a result of any new information, future events or otherwise. Our future results may be different from those described in our forward-looking statements for a variety of reasons, including any failure to generate a supply of consigned goods, pricing pressure on the consignment market resulting from discounting in the market for new goods, failure to efficiently and effectively operate our merchandising and fulfillment operations and other reasons. A list and description of risks, uncertainties and other factors that could cause or contribute to differences in our results can be found in our filings with the Securities and Exchange Commission, including our Form 10Q and our S-1 filing. We qualify all of our forward-looking statements by these cautionary statements.
Non-GAAP Financial Measures
To supplement our unaudited and condensed financial statements presented in accordance with generally accepted accounting principles ("GAAP"), this earnings release and the accompanying tables and the related earnings conference call contain certain non-GAAP financial measures, including Adjusted EBITDA, Adjusted EBITDA as a percentage of total net revenue ("Adjusted EBITDA Margin"), free cash flow and non-GAAP net loss and diluted net loss per share. We have provided a reconciliation of these non-GAAP financial measures to the most directly comparable GAAP financial measure in this earnings release.
We do not, nor do we suggest that investors should, consider such non-GAAP financial measures in isolation from, or as a substitute for, financial information prepared in accordance with GAAP. Investors should also note that non-GAAP financial measures we use may not be the same non-GAAP financial measures, and may not be calculated in the same manner, as that of other companies, including other companies in our industry.
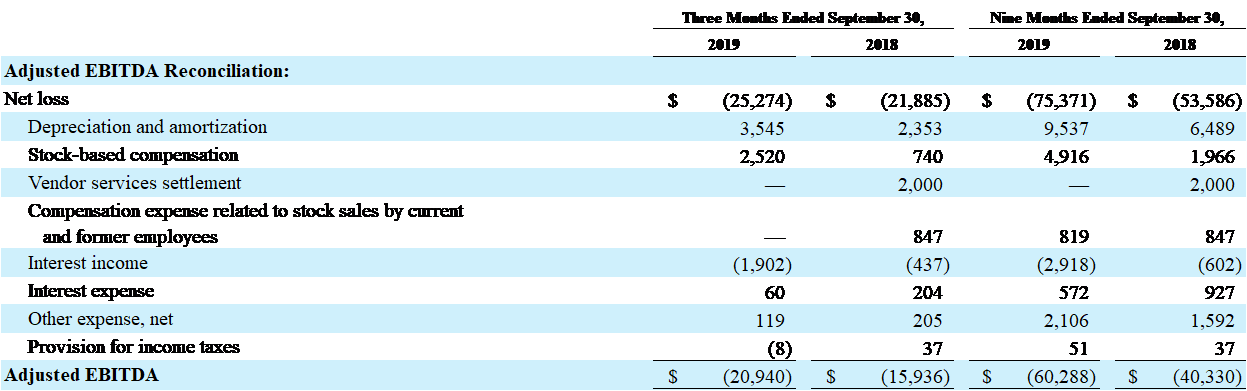
Adjusted EBITDA is a key performance measure that our management uses to assess our operating performance. Because Adjusted EBITDA facilitates internal comparisons of our historical operating performance on a more consistent basis, we use this measure as an overall assessment of our performance, to evaluate the effectiveness of our business strategies and for business planning purposes. Adjusted EBITDA may not be comparable to similarly titled metrics of other companies.
We calculate Adjusted EBITDA as net loss before net interest expense, income tax provision, depreciation and amortization, and remeasurement of preferred stock warrant liability included in other expense, further adjusted to exclude stock-based compensation, and certain one-time expenses. Adjusted EBITDA has certain limitations as the measure excludes the impact of certain expenses that are included in our statements of operations that are necessary to run our business and should not be considered as an alternative to net loss or any other measure of financial performance calculated and presented in accordance with GAAP.
In particular, the exclusion of certain expenses in calculating Adjusted EBITDA and Adjusted EBITDA Margin facilitates operating performance comparisons on a period-to-period basis and, in the case of exclusion of the impact of equity-based compensation and related taxes, excludes an item that we do not consider to be indicative of our core operating performance. Investors should, however, understand that equity-based compensation will be a significant recurring expense in our business and an important part of the compensation provided to our employees. Accordingly, we believe that Adjusted EBITDA and Adjusted EBITDA Margin provide useful information to investors and others in understanding and evaluating our operating results in the same manner as our management and board of directors.
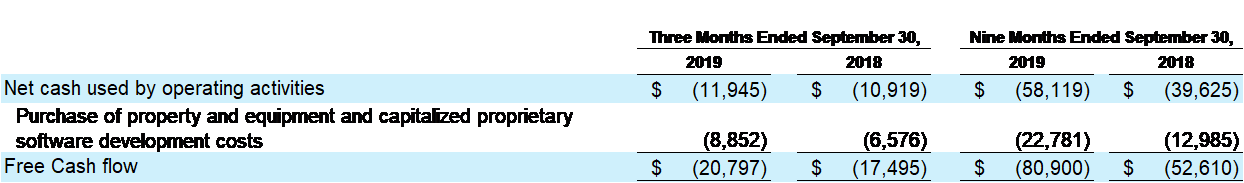
Free cash flow is a non-GAAP financial measure that is calculated as net cash (used in) provided by operating activities less net cash used to purchase property and equipment and capitalized proprietary software development costs. We believe free cash flow is an important indicator of our business performance, as it measures the amount of cash we generate. Accordingly, we believe that free cash flow provides useful information to investors and others in understanding and evaluating our operating results in the same manner as our management.
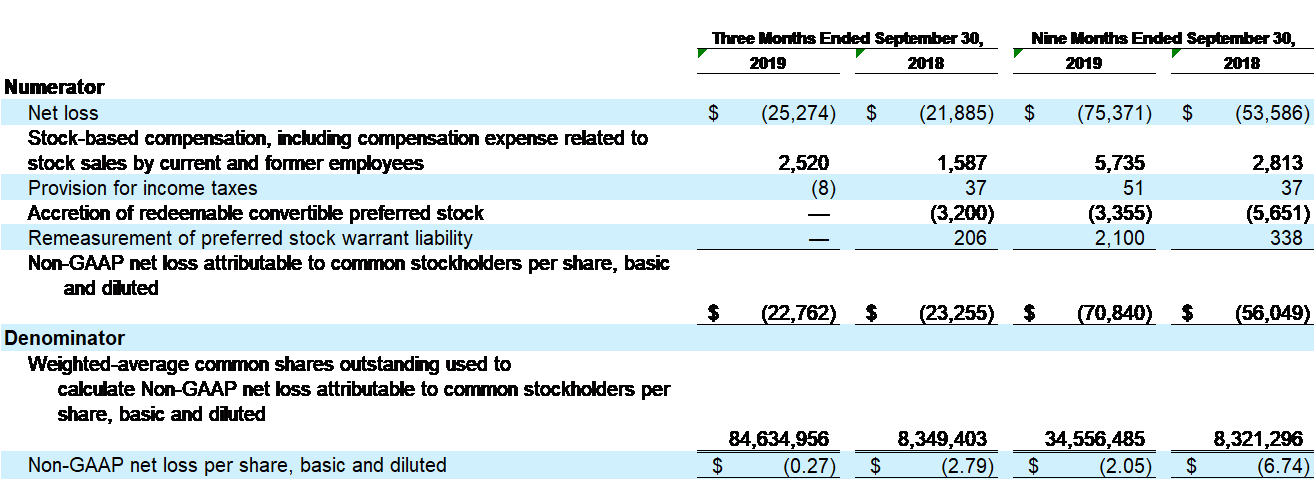
Non-GAAP diluted net loss per share is a non-GAAP financial measure that is calculated as GAAP net loss plus equity-based compensation expense and related taxes, (benefit from) provision for income taxes, and nonrecurring items divided by weighted average shares. We believe that adding back equity-based compensation expense and related taxes and (benefit from) provision for income taxes, and non-recurring items as adjustments to our GAAP diluted net loss, before calculating per share amounts for all periods presented provides a more meaningful comparison between our operating results from period to period.
The following table reflects the reconciliation of net loss to Adjusted EBITDA for each of the periods indicated (in thousands):
A reconciliation of GAAP net loss to non-GAAP diluted net loss, the most directly comparable GAAP financial measure, in order to calculate non-GAAP diluted net loss per share, is as follows (in thousands, except per share data):
The following table presents a reconciliation of net cash used in operating activities to free cash flow for each of the periods indicated (in thousands):
Key Financial and Operating Metrics: